Using Cowplot to add logos to ggplots
If you use freely available data in your work, it’s polite to give credit. You can do this with a text caption or by placing a logo inside your image.
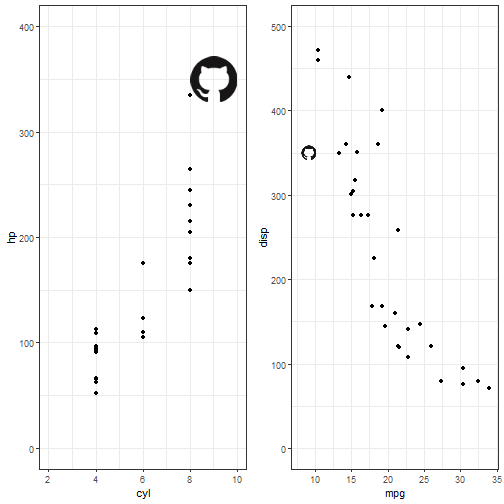
In ggplot you can add a text caption easily, but an image is a more complicated. This image is placed by plot coordinates, not very effectively.
annotation_custom(github, xmin=8, xmax=10, ymin=300, ymax=400)

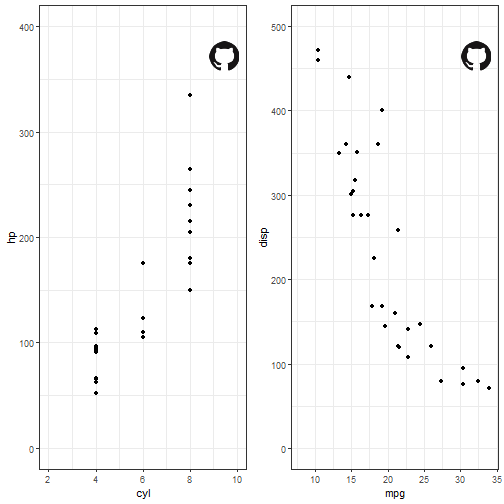
The Cowplot package will do this better by placing an image in the same relative position.
Using Cowplot
Install Cowplot and create a function like this.
You can hard-code the file name and coordinates to the function or take them in as arguments.
add_logo <- function(plots,image_path){
  plots_logo <- list()

  for(i in 1:length(plots)){
    name <- names(plots[i])
    plots_logo[[name]] <-
      plots[[i]] %>%
      ggdraw() +
      draw_image(image_path,
                 x=0.95,
                 y=0.95,
                 hjust=1,
                 vjust=1,
                 width=0.12,
                 height=0.12)
  }
  return(plots_logo)
}
Then call the function with your list of ggplots.

Useful links
Written on July 16, 2020